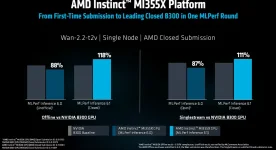
MLPerf Inference v6.1 published 120 systems from 30 submitters, spread across datacenter and edge suites, five scenarios, and two submission divisions. A leaderboard number can look wonderfully clean while hiding most of the conditions that produced it.
Start with the MLPerf 6.1 benchmark results, and you quickly run into totals measured on one accelerator, eight accelerators, a rack, or hundreds of GPUs. Comparing the largest score in the column is useful only when you also know what the column actually represents.
MLPerf was built to make very different systems comparable, but comparability still has boundaries. The original MLPerf Inference benchmarking methodology describes a framework designed around representative workloads, reproducibility, and architecture-neutral measurement rather than one universal speed score.
Open submissions deliberately loosen those restrictions. Retraining, model substitution, and other changes can be allowed, making the division useful for seeing what aggressive optimization can achieve, but not for a simple hardware-versus-hardware verdict.
Closed still does not mean hardware-only. Submitters can tune serving software, kernels, quantization paths where permitted, scheduling, communication, and other implementation details inside the rules, so the result measures the complete submitted system rather than an accelerator stripped of its software.
This matters when the same GPU suddenly posts a better score six months later. The chip may be unchanged while compilers, libraries, kernels, inference engines, batching, memory management, or model execution improve around it.
Availability labels add another filter. Available means the submitted components can already be bought or rented, Preview means the system is expected to become Available in the next round, and RDI covers research, development, or internal systems.
A Preview result can show where performance is heading without describing hardware you can necessarily order today. MLCommons has also invalidated past Preview submissions when they did not return as Available in the following round, so the label has teeth.
The server sends requests under an arrival pattern and applies latency requirements. A system therefore has to sustain useful throughput without letting responses drift beyond the benchmark's limits, which makes the score closer to a busy serving environment than an unrestricted batch run.
Interactive is stricter about responsiveness for supported language workloads, while SingleStream and MultiStream appear on edge benchmarks where latency and stream handling matter differently. MLPerf v6.1 uses Offline, Server, and Interactive in the datacenter suite, with SingleStream, MultiStream, and Offline appearing on edge workloads according to the benchmark.
Never compare an Offline result directly with a Server result just because both are expressed as throughput. The underlying load pattern is different, and the optimization that wins when every request is known in advance may lose once requests arrive over time with latency constraints attached.
Model variants matter too. Accuracy targets, scenario rules, benchmark versions, and even permitted techniques can change between workloads or rounds. GPT-OSS-120B in v6.1, for example, changed its Interactive rules to permit speculative decoding, while the VLM benchmark gained a newly defined Interactive scenario.
A 512-accelerator system should produce an enormous aggregate number if the software and network scale well. Dividing that result by 512 creates a useful per-accelerator figure, but even this normalization needs care because large systems carry communication, host, topology, and scheduling effects that a single-device run does not share.
A cleaner comparison keeps the model, scenario, division, availability class, accelerator generation, and accelerator count as close as possible. When counts differ, per-device normalization can reveal scaling behavior, but the full system score still matters if your actual purchase looks like the submitted configuration.
Software metadata deserves the same attention as the accelerator name. MLPerf result rows identify the submitted system and software stack, so two servers carrying nominally identical GPUs can legitimately post different numbers without either result being wrong.
Benchmark headlines often compress all of this into a winner and a percentage. The more useful reading is narrower. Decide whether you care about batch throughput, latency-constrained serving, interactive response, edge latency, commercially available hardware, or experimental systems first, then compare results inside that lane.
Start with the MLPerf 6.1 benchmark results, and you quickly run into totals measured on one accelerator, eight accelerators, a rack, or hundreds of GPUs. Comparing the largest score in the column is useful only when you also know what the column actually represents.
MLPerf was built to make very different systems comparable, but comparability still has boundaries. The original MLPerf Inference benchmarking methodology describes a framework designed around representative workloads, reproducibility, and architecture-neutral measurement rather than one universal speed score.
Closed and Open results answer different questions
Closed submissions are the safest starting point when you want an apples-to-apples comparison. MLCommons requires the model to remain mathematically equivalent to the reference implementation, so a vendor cannot simply swap in an easier model and present the faster result as the same test.Open submissions deliberately loosen those restrictions. Retraining, model substitution, and other changes can be allowed, making the division useful for seeing what aggressive optimization can achieve, but not for a simple hardware-versus-hardware verdict.
Closed still does not mean hardware-only. Submitters can tune serving software, kernels, quantization paths where permitted, scheduling, communication, and other implementation details inside the rules, so the result measures the complete submitted system rather than an accelerator stripped of its software.
This matters when the same GPU suddenly posts a better score six months later. The chip may be unchanged while compilers, libraries, kernels, inference engines, batching, memory management, or model execution improve around it.
Availability labels add another filter. Available means the submitted components can already be bought or rented, Preview means the system is expected to become Available in the next round, and RDI covers research, development, or internal systems.
A Preview result can show where performance is heading without describing hardware you can necessarily order today. MLCommons has also invalidated past Preview submissions when they did not return as Available in the following round, so the label has teeth.
Offline and Server scores reward different behavior
Offline gives the system all requests at once and lets it schedule them for maximum throughput. It is a strong test of bulk processing, batching, accelerator utilization, and how efficiently a stack can keep its hardware busy.The server sends requests under an arrival pattern and applies latency requirements. A system therefore has to sustain useful throughput without letting responses drift beyond the benchmark's limits, which makes the score closer to a busy serving environment than an unrestricted batch run.
Interactive is stricter about responsiveness for supported language workloads, while SingleStream and MultiStream appear on edge benchmarks where latency and stream handling matter differently. MLPerf v6.1 uses Offline, Server, and Interactive in the datacenter suite, with SingleStream, MultiStream, and Offline appearing on edge workloads according to the benchmark.
Never compare an Offline result directly with a Server result just because both are expressed as throughput. The underlying load pattern is different, and the optimization that wins when every request is known in advance may lose once requests arrive over time with latency constraints attached.
Model variants matter too. Accuracy targets, scenario rules, benchmark versions, and even permitted techniques can change between workloads or rounds. GPT-OSS-120B in v6.1, for example, changed its Interactive rules to permit speculative decoding, while the VLM benchmark gained a newly defined Interactive scenario.
Scale can make a huge score easy to misread
Total throughput answers how much work the complete submitted system finished. It does not automatically answer which accelerator is faster, which server is more efficient, or which deployment gives you the best value.A 512-accelerator system should produce an enormous aggregate number if the software and network scale well. Dividing that result by 512 creates a useful per-accelerator figure, but even this normalization needs care because large systems carry communication, host, topology, and scheduling effects that a single-device run does not share.
A cleaner comparison keeps the model, scenario, division, availability class, accelerator generation, and accelerator count as close as possible. When counts differ, per-device normalization can reveal scaling behavior, but the full system score still matters if your actual purchase looks like the submitted configuration.
Software metadata deserves the same attention as the accelerator name. MLPerf result rows identify the submitted system and software stack, so two servers carrying nominally identical GPUs can legitimately post different numbers without either result being wrong.
Benchmark headlines often compress all of this into a winner and a percentage. The more useful reading is narrower. Decide whether you care about batch throughput, latency-constrained serving, interactive response, edge latency, commercially available hardware, or experimental systems first, then compare results inside that lane.